Why is this a difficult task?
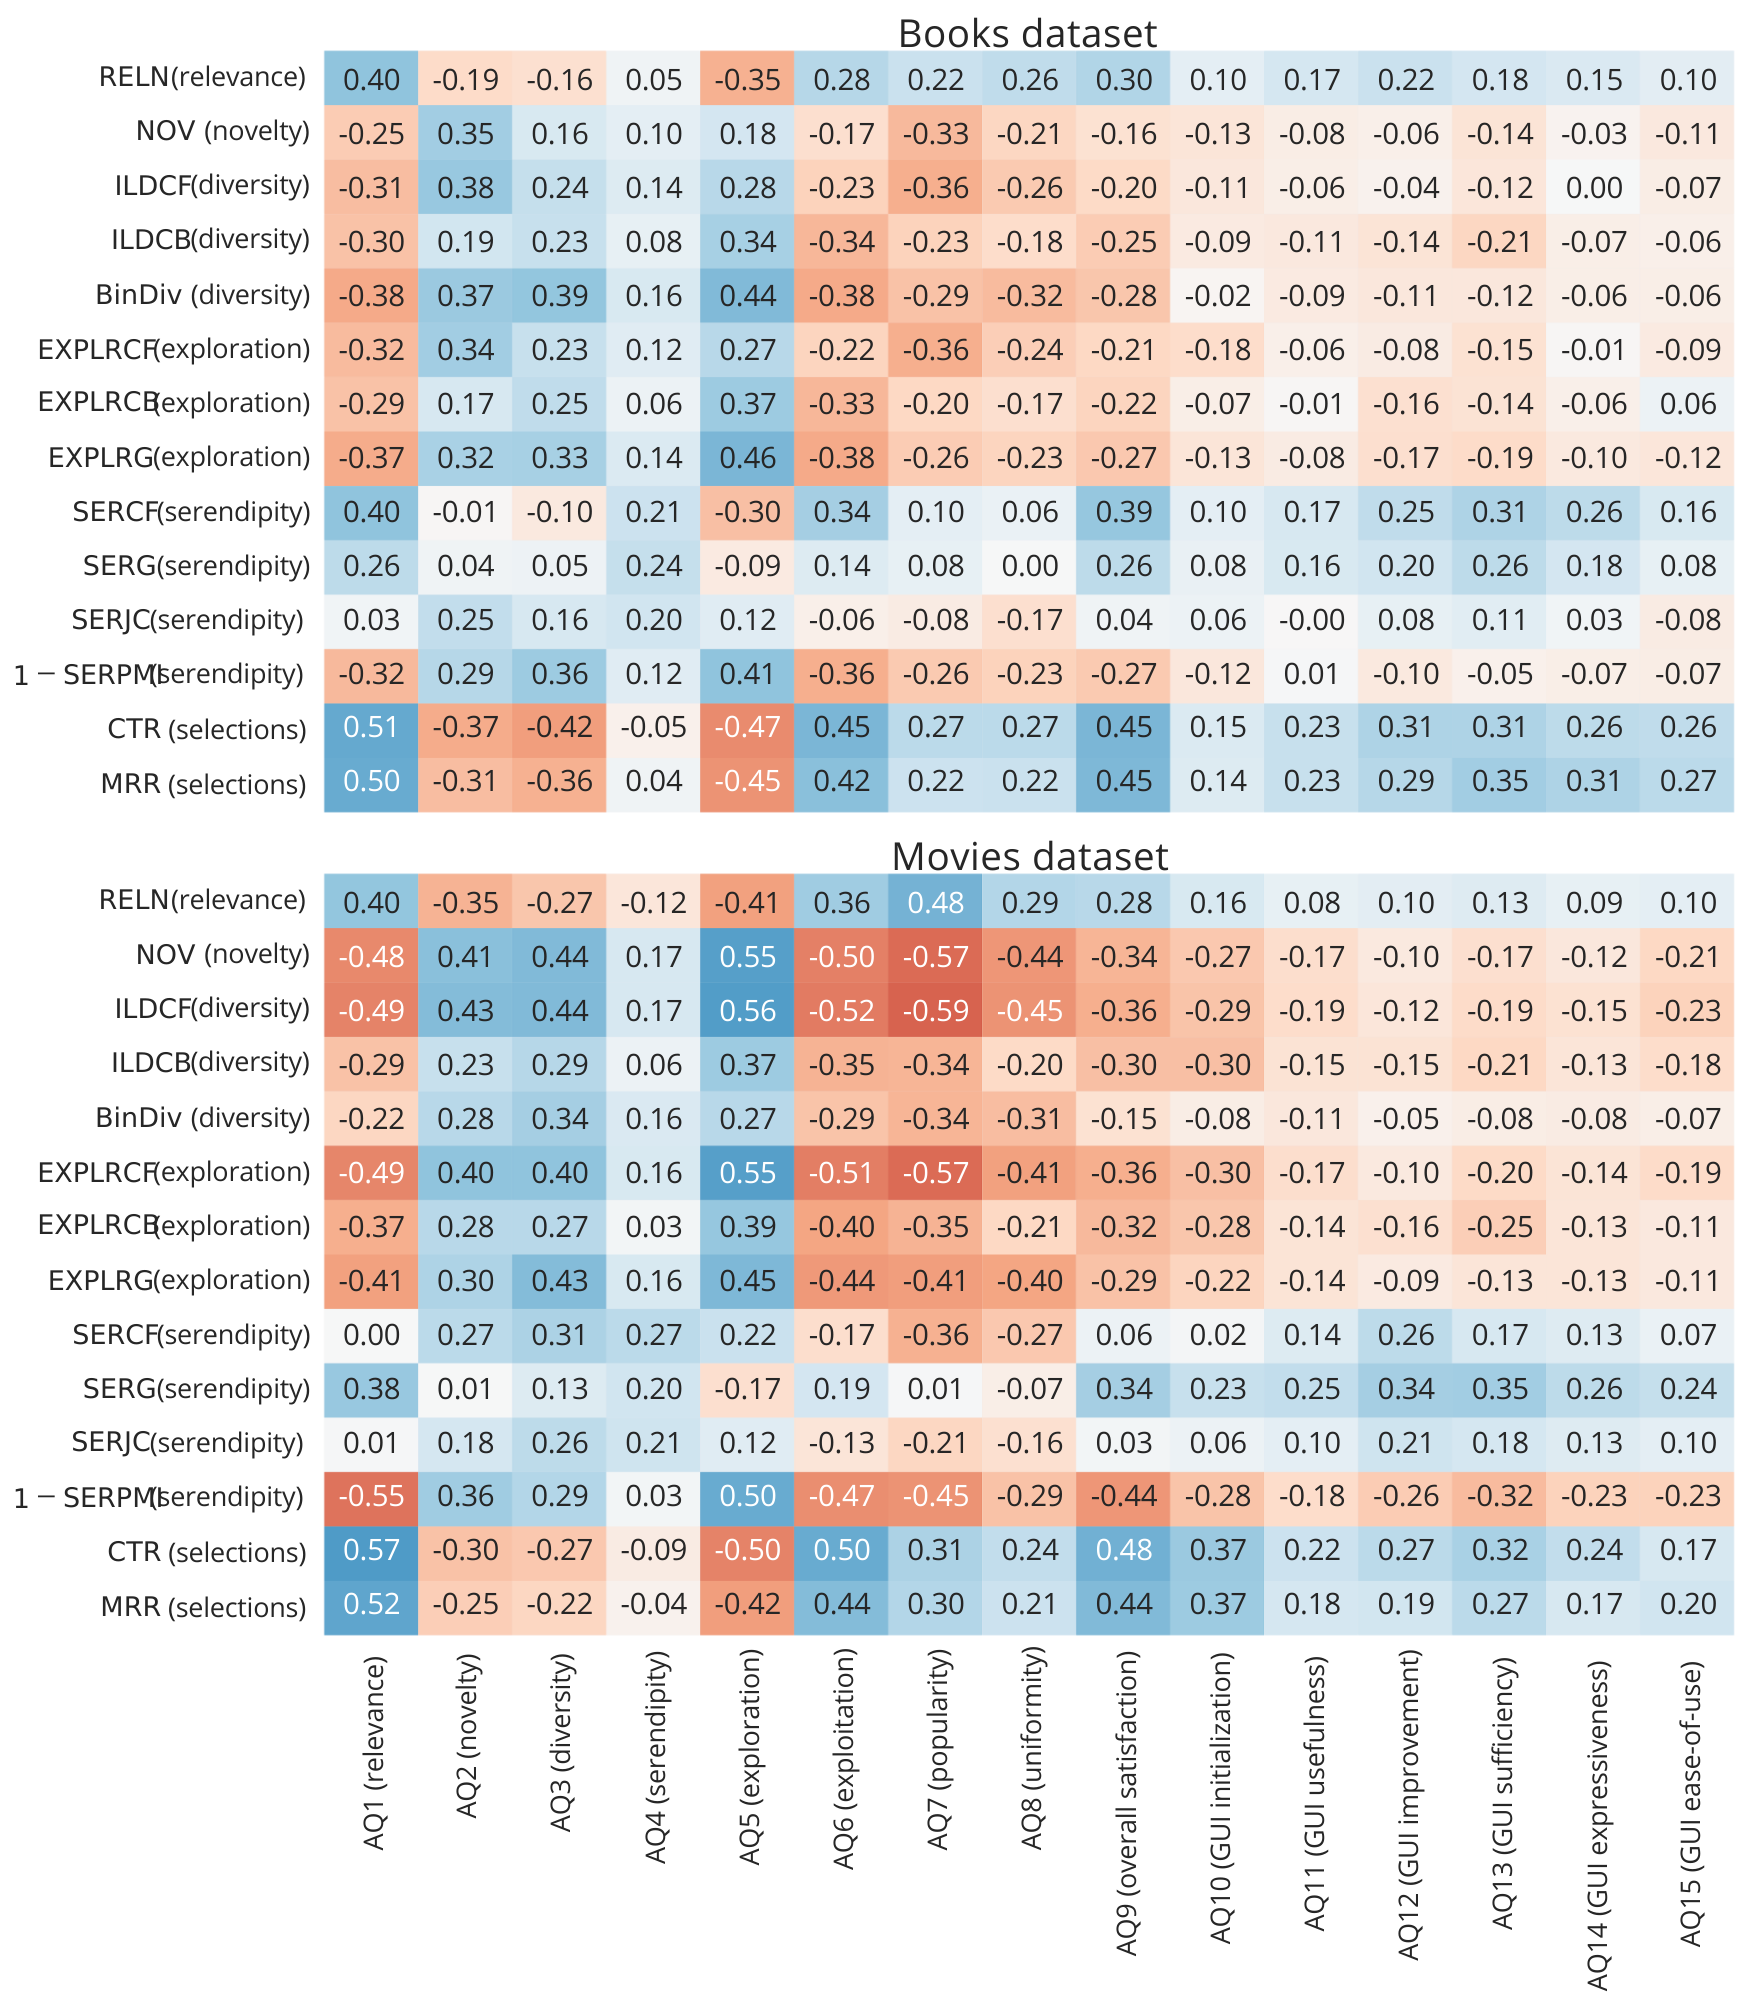
- we tried several common serendipity metrics; none of those provided a reasonable correlation with the user-perceived serendipity
- also no other evaluated metric was any better (we tried Pearsons correlation)
Your task would be to devise a metric, that would be capable of measuring (predicting, in case it will have a training part) to what extent were displayed results serendipitous from the user's perspective. Serendipity is one of the key concepts behind trully successfull recommendations, but on the other hand, it is notorously difficult to properly quantify.
At your disposal, there are results of a user study conducted on movie and book domains, where users were exposed to several iterations of recommendations (18 in total, supplied by 3 different algorithms). After each block of 6 iterations, users were asked to fill-in a questionnaire including their perception of recommendations serendipity. Your task is to use other available information (or collect some additional) to estimate this value.
Source data: https://osf.io/chbj9/?view_only=460e981414d349a3b667c254e3b5632d
Work-in-progress report: in the root folder. You probably only need to focus on sections 3,4 (study design and implemented algorithm variants), and eventually in the results on RQ2
common folder
data folder
serendipity_task folder
* not all information, but a substantial part:-)
import numpy as np
import pandas as pd
import json
C:\Users\lpesk\AppData\Roaming\Python\Python38\site-packages\pandas\core\computation\expressions.py:20: UserWarning: Pandas requires version '2.7.3' or newer of 'numexpr' (version '2.7.1' currently installed).
  from pandas.core.computation.check import NUMEXPR_INSTALLED
study_results = pd.read_json("serendipity_task/df_iteration_impressions_selections_serendipities.json")
questionnaire_results = pd.read_json("serendipity_task/after_block_questionnaire.json")

study_results["block"] = study_results["iteration"] // 6
study_results["block_iteration"] = study_results["iteration"] % 6
study_results.head(3)

#participation: ID of a user
#items: list of items displayed to the participant at this iteration
#selected_items = list of items the user selected at this iteration
#iteration: identification of the step in the study (0-17)
#   - the study was divided into 3 blocks (each served by a different algorithm), followed by the questionnaire
#   - block and block_iteration provide this information
#all other columns represent individual metrics evaluated on the full list of recommendations, or on the selected items ("sel" prefix)
#  - check the paper for metrics definitions
| index | participation | items | selected_items | iteration | cf_ild | cb_ild | bin_div | relevance | sel_cb_surprise | sel_cb_unexpectedness | sel_cf_unexpectedness | sel_incremental_genre_coverage | sel_pmi_unexpectedness | block | block_iteration | |
|---|---|---|---|---|---|---|---|---|---|---|---|---|---|---|---|---|
| 0 | 0 | 61 | [1218, 4682, 745, 12886, 9719, 3416, 6387, 279... | [2796, 6387, 12886, 3416, 1723] | 0 | 0.490715 | 0.533223 | 0.457035 | 18.308832 | 0.313333 | 0.723443 | 0.638649 | 0.0 | 0.205209 | 0 | 0 |
| 1 | 1 | 61 | [10199, 12644, 1996, 9609, 11478, 12514, 9267,... | [9312, 9609, 5524, 10199, 7736] | 1 | 0.658099 | 0.508626 | 0.328032 | 14.200634 | 0.190000 | 0.636354 | 0.662195 | 0.0 | 0.258737 | 0 | 1 |
| 2 | 2 | 61 | [6707, 7784, 12259, 9072, 10906, 10193, 4648, ... | [12259, 1800, 3948, 10193, 10906] | 2 | 0.587088 | 0.507497 | 0.238507 | 12.025384 | 0.073333 | 0.634591 | 0.625639 | 0.0 | 0.270986 | 0 | 2 |
questionnaire_results.head(5)
#dataset: which dataset the participant worked on
#participation: ID of the user
#block: to which block this questionnaire results correspond
#q1 - q9: responses to questions, 6-point Likert scale (strongly disagree = -3, somewhat agree = 1 etc.)
#   - nan correspond to "I dont understand" response
#   - q4 correspond to serendipity perception, i.e., this is your target value
| index | dataset | participation | block | q1 | q2 | q3 | q4 | q5 | q6 | q7 | q8 | q9 | |
|---|---|---|---|---|---|---|---|---|---|---|---|---|---|
| 0 | 0 | movies | 61 | 0 | 1.0 | -1.0 | 1.0 | -1.0 | -1.0 | -1.0 | 1.0 | 1.0 | 1.0 |
| 1 | 389 | movies | 63 | 0 | 3.0 | -1.0 | 2.0 | 3.0 | 1.0 | -2.0 | 1.0 | -2.0 | 3.0 |
| 2 | 1012 | movies | 61 | 1 | -1.0 | -3.0 | -1.0 | -1.0 | 2.0 | -2.0 | 1.0 | -1.0 | -1.0 |
| 3 | 1370 | movies | 61 | 2 | -1.0 | 1.0 | 1.0 | -1.0 | 1.0 | -1.0 | 1.0 | 1.0 | 1.0 |
| 4 | 1723 | movies | 63 | 1 | 2.0 | 1.0 | -2.0 | -2.0 | -2.0 | 2.0 | 3.0 | 3.0 | 2.0 |
# list of all questions:
# AQ1 relevance perception    The recommended movies matched my interests.
# AQ2 novelty perception      ... were mostly novel to me.
# AQ3 diversity perception    ... were highly different from each other.
# AQ4 serendipity perception  ... were unexpected yet interesting to me.
# AQ5 exploration perception  ... differed from my usual choices.
# AQ6 exploitation perception ... were mostly similar to what I usually watch.
# AQ7 popularity perception   ... mostly popular (i.e., blockbusters).
# AQ8 uniformity perception   ... mostly similar to each other.
# AQ9 overall satisfaction    Overall, I am satisfied with the recommended movies.
array([ 1., 3., -1., 2., -3., -2., nan])
We tried several different notions of items similarity, so - although I believe there is still some space for further research, perhaps there are also other possible areas of interest, namely:
There are multiple possible ways to tackle this problem. So, pick 2-3 promissing directions that sounds like fun to you and check them out (check them out = justify, code, evaluate, and analyze). Positive results are warmly wellcomed, yet the negative are expected (wellcome to the real world:-). Although, in case of negative results, I might ask you to go a few steps further to check few other options and so on.
# loading data
#item_item_movies = np.load("data/movieLens/item_item.npy")
item_item_books = np.load("data/goodbooks-10k/item_item.npy")

#distance_matrix_cf_movies = np.load("data/movieLens/distance_matrix_rating.npy")
distance_matrix_cf_books = np.load("data/goodbooks-10k/distance_matrix_rating.npy")

(item_item_books.shape, distance_matrix_cf_books.shape)
((6548, 6548), (6548, 6548))
#unexpectedness of a single item
def item_unexpectedness(user_history, item, distance_matrix):
    return distance_matrix[user_history, item].mean()

#unexpectedness of a list of items, using collaborative distance matrix
def list_unexpectedness_cf(user_history, rec_list, dataset):
    if len(rec_list) == 0 or len(user_history) == 0:
        return 0
    if dataset == "movies":
        return np.array([item_unexpectedness(user_history, x, distance_matrix_cf_movies) for x in rec_list]).mean()
    elif dataset == "books":
        return np.array([item_unexpectedness(user_history, x, distance_matrix_cf_books) for x in rec_list]).mean()


#usage in our codes:
# for i, row in df.iterrows():
#     full_hist = np.unique(elicitation_hist + iteration_hist)
#     df.loc[i, "sel_cf_unexpectedness"] = list_unexpectedness_cf(full_hist, curr_iter_selections, row.dataset)
#usage example
item_unexpectedness([1,5],6,distance_matrix_cf_books)
0.6519418720830903
#usage example
list_unexpectedness_cf([1,3,5,7], [2,4,6], "books")
0.5961706642294122
NEG_INF = -1e6

#estimated relevance of all items, using the knowledge of items previously selected by the user
def predict_scores(item_item, all_items, selected_items, filter_out_items, k=10):
    user_vector = np.zeros(shape=(all_items.size,), dtype=item_item.dtype)
    if selected_items.size == 0:
        return np.zeros_like(user_vector)
    user_vector[selected_items] = 1
    probs = np.dot(user_vector, item_item)
    # Here the NEG_INF used for masking must be STRICTLY smaller than probs predicted by the algorithms
    # So that the masking works properly
    assert NEG_INF < probs.min()
    # Mask out selected items
    probs[selected_items] = NEG_INF
    # Mask out items to be filtered
    probs[filter_out_items] = NEG_INF
    return probs
#usage example
all_books = pd.Series(range(0,item_item_books.shape[0]))
probs = predict_scores(item_item_books, all_books, pd.Series([6,7]), pd.Series([2]))
pd.Series(probs).describe()
count       6548.000000
mean        -458.154907
std        21402.509766
min     -1000000.000000
25%           -0.000657
50%            0.000003
75%            0.000671
max            0.246466
dtype: float64
from sklearn.preprocessing import QuantileTransformer

#normalization for the relevance scores; top-k here induces the indices of items (those recommended to the user)
def relevance_normed_movies(top_k, selected_items, filter_out_items):
    rel_scores = predict_scores(item_item_movies, all_movies, selected_items, filter_out_items, top_k.size)
    rel_scores_normed = QuantileTransformer().fit_transform(rel_scores.reshape(-1, 1)).reshape(rel_scores.shape)
    return rel_scores_normed[top_k].mean()#.sum()

#normalization for the relevance scores; top-k here induces the indices of items (those recommended to the user)
def relevance_normed_books(top_k, selected_items, filter_out_items):
    rel_scores = predict_scores(item_item_books, all_books, selected_items, filter_out_items, top_k.size)
    rel_scores_normed = QuantileTransformer().fit_transform(rel_scores.reshape(-1, 1)).reshape(rel_scores.shape)
    return rel_scores_normed[top_k].mean()#.sum()
normed_scores = relevance_normed_books(pd.Series([1,4,9]),pd.Series([6,7]), pd.Series([2]))
normed_scores
0.9987033